Comparison
stats vs MacBookBatteryMonitor
stats is the most popular free, open-source menu-bar monitor for macOS. It is excellent at what it does. For battery specifically, it reads the same vitals everyone else does, and it stops where they all stop.
 vs
vs
Side by side
Finding the app that is draining the battery, and stopping it
stats ranks top processes by a unitless power score. MacBookBatteryMonitor ranks them by watts, flags hidden workloads, and lets you cap, offload, or kill an app from the same row.
MacBookBatteryMonitorWinner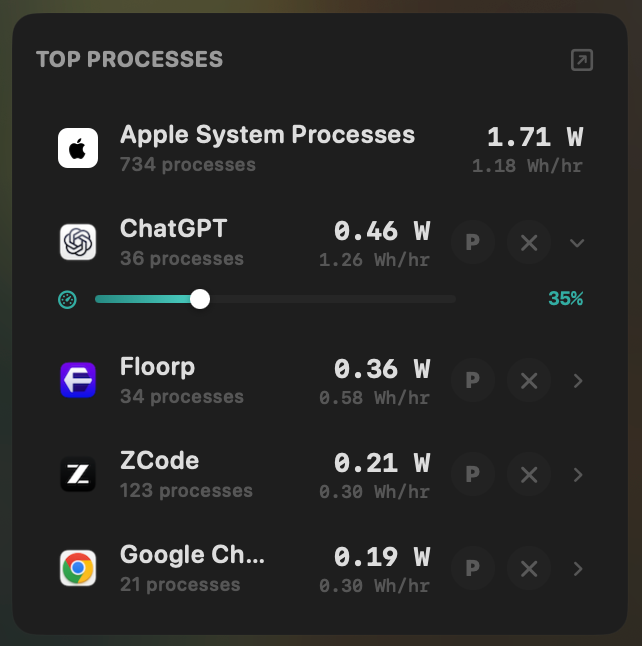
- Yes:Live per-app power draw · Process-level, real-time
- Yes:Hidden-workload detection · Docker, cloudflared, launchd
- Yes:Per-app CPU throttle · 10% to 100% slider
- Yes:E-core offload · Per-app toggle
- Yes:One-click kill · Runaway apps + subprocesses
stats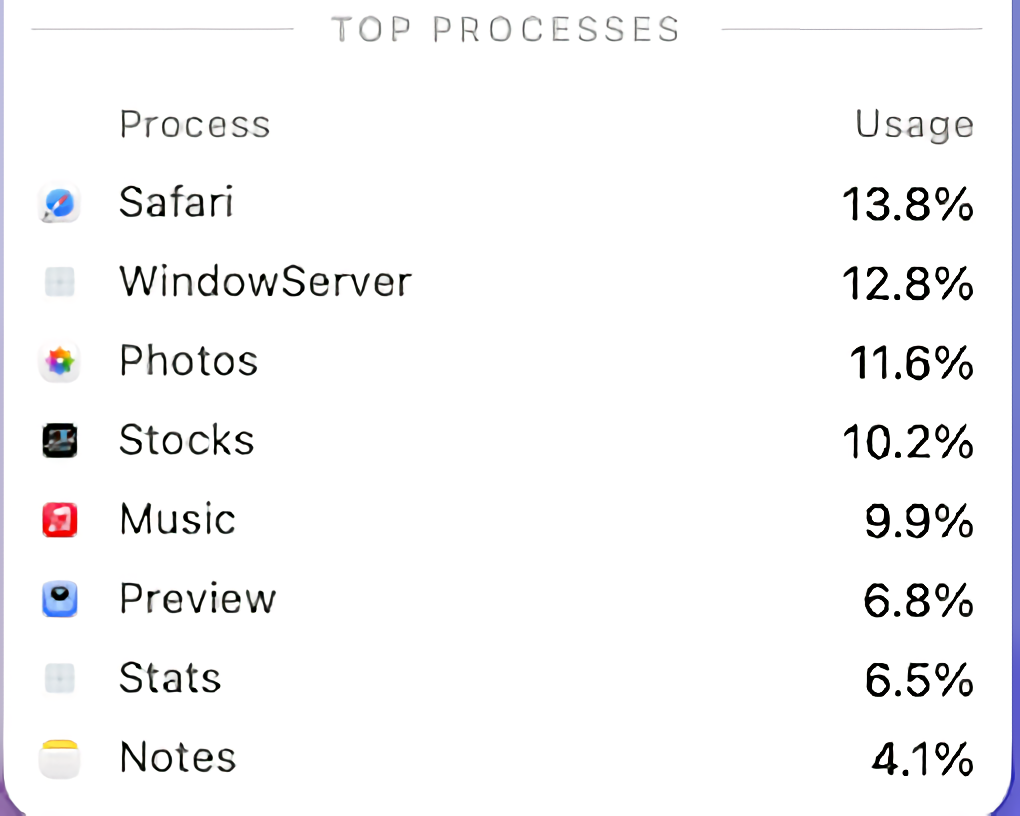
- Partial:Live per-app power draw · Unitless "top" power score
- No:Hidden-workload detection
- No:Per-app CPU throttle
- No:E-core offload
- No:One-click kill
Seeing where the power goes
Both show total system power. stats reads it in its battery popover alongside CPU, GPU, memory, disk, network, and sensors. MacBookBatteryMonitor splits it into CPU+GPU, RAM, display, and USB with a Power Flow diagram.
MacBookBatteryMonitorWinner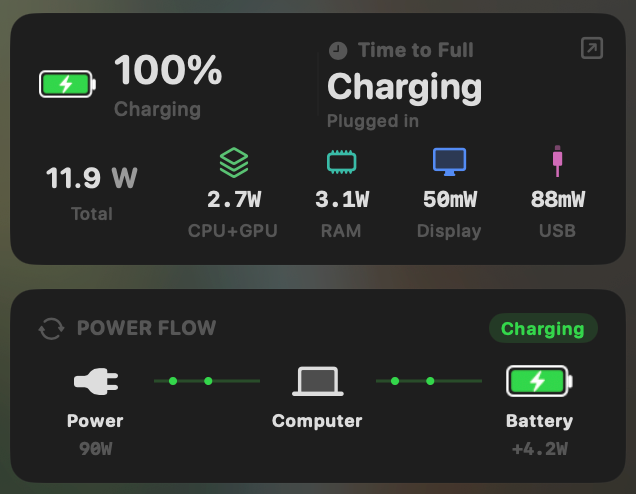
- Yes:System total power draw · Live, in watts
- Yes:Power breakdown by component · CPU / GPU / RAM / Display / USB
stats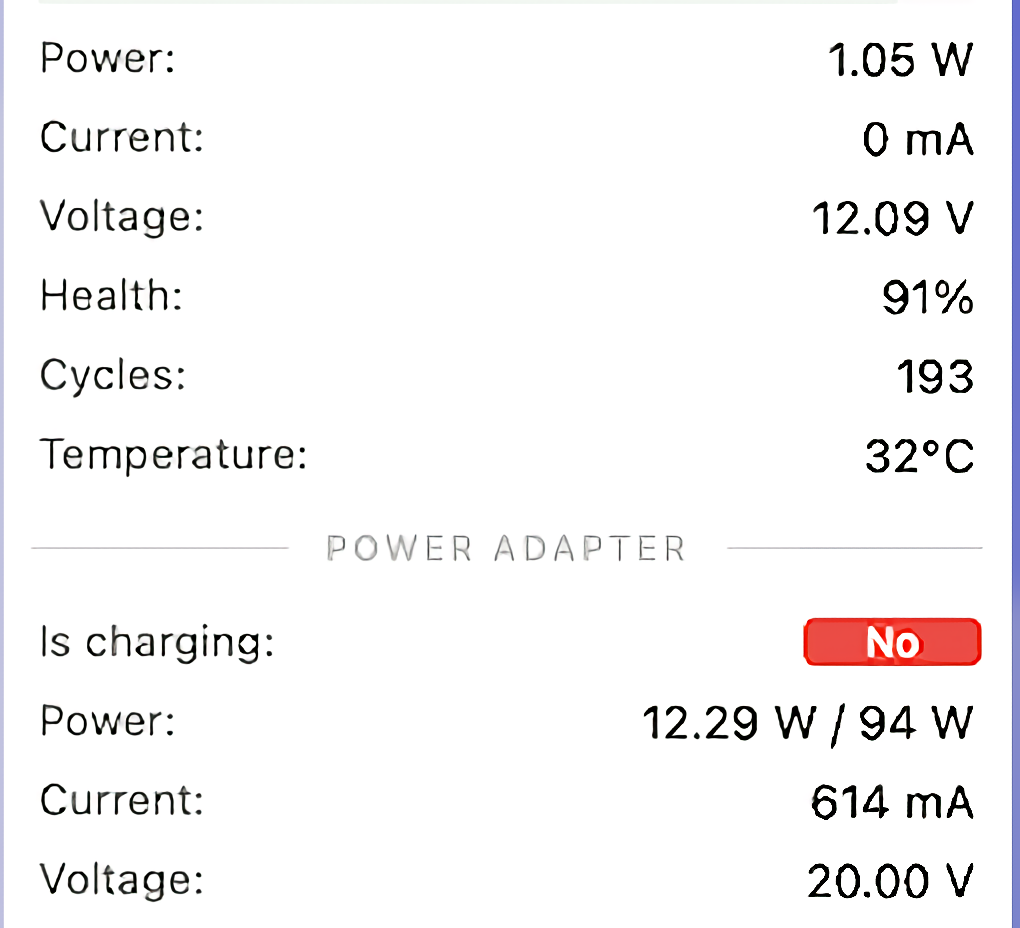
- Yes:System total power draw
- No:Power breakdown by component
Charge limit and Sailing Mode
stats has no charge control; the feature is a long-standing request. MacBookBatteryMonitor sets a 50% to 100% charge limit over SMC, sails to it while plugged in, and switches on Low Power Mode by itself.
MacBookBatteryMonitorWinner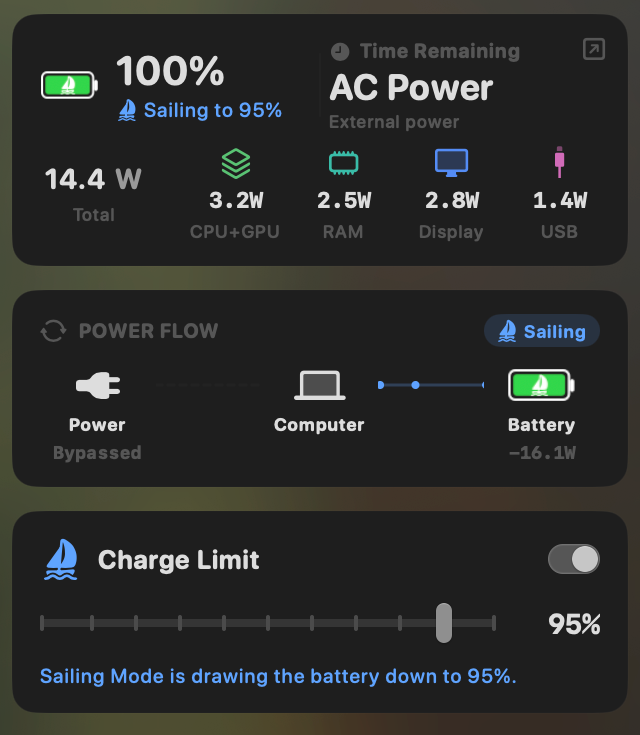
- Yes:Charge limit · 50% to 100% via SMC
- Yes:Sailing mode · Discharge while plugged in
- Yes:Low Power Mode automation · Auto below a threshold
stats- No:Charge limit · Feature requested, not built
- No:Sailing mode
- No:Low Power Mode automation
Battery health
Both read health, cycle count, and temperature. MacBookBatteryMonitor adds the design cycle limit and a condition label.
MacBookBatteryMonitorDraw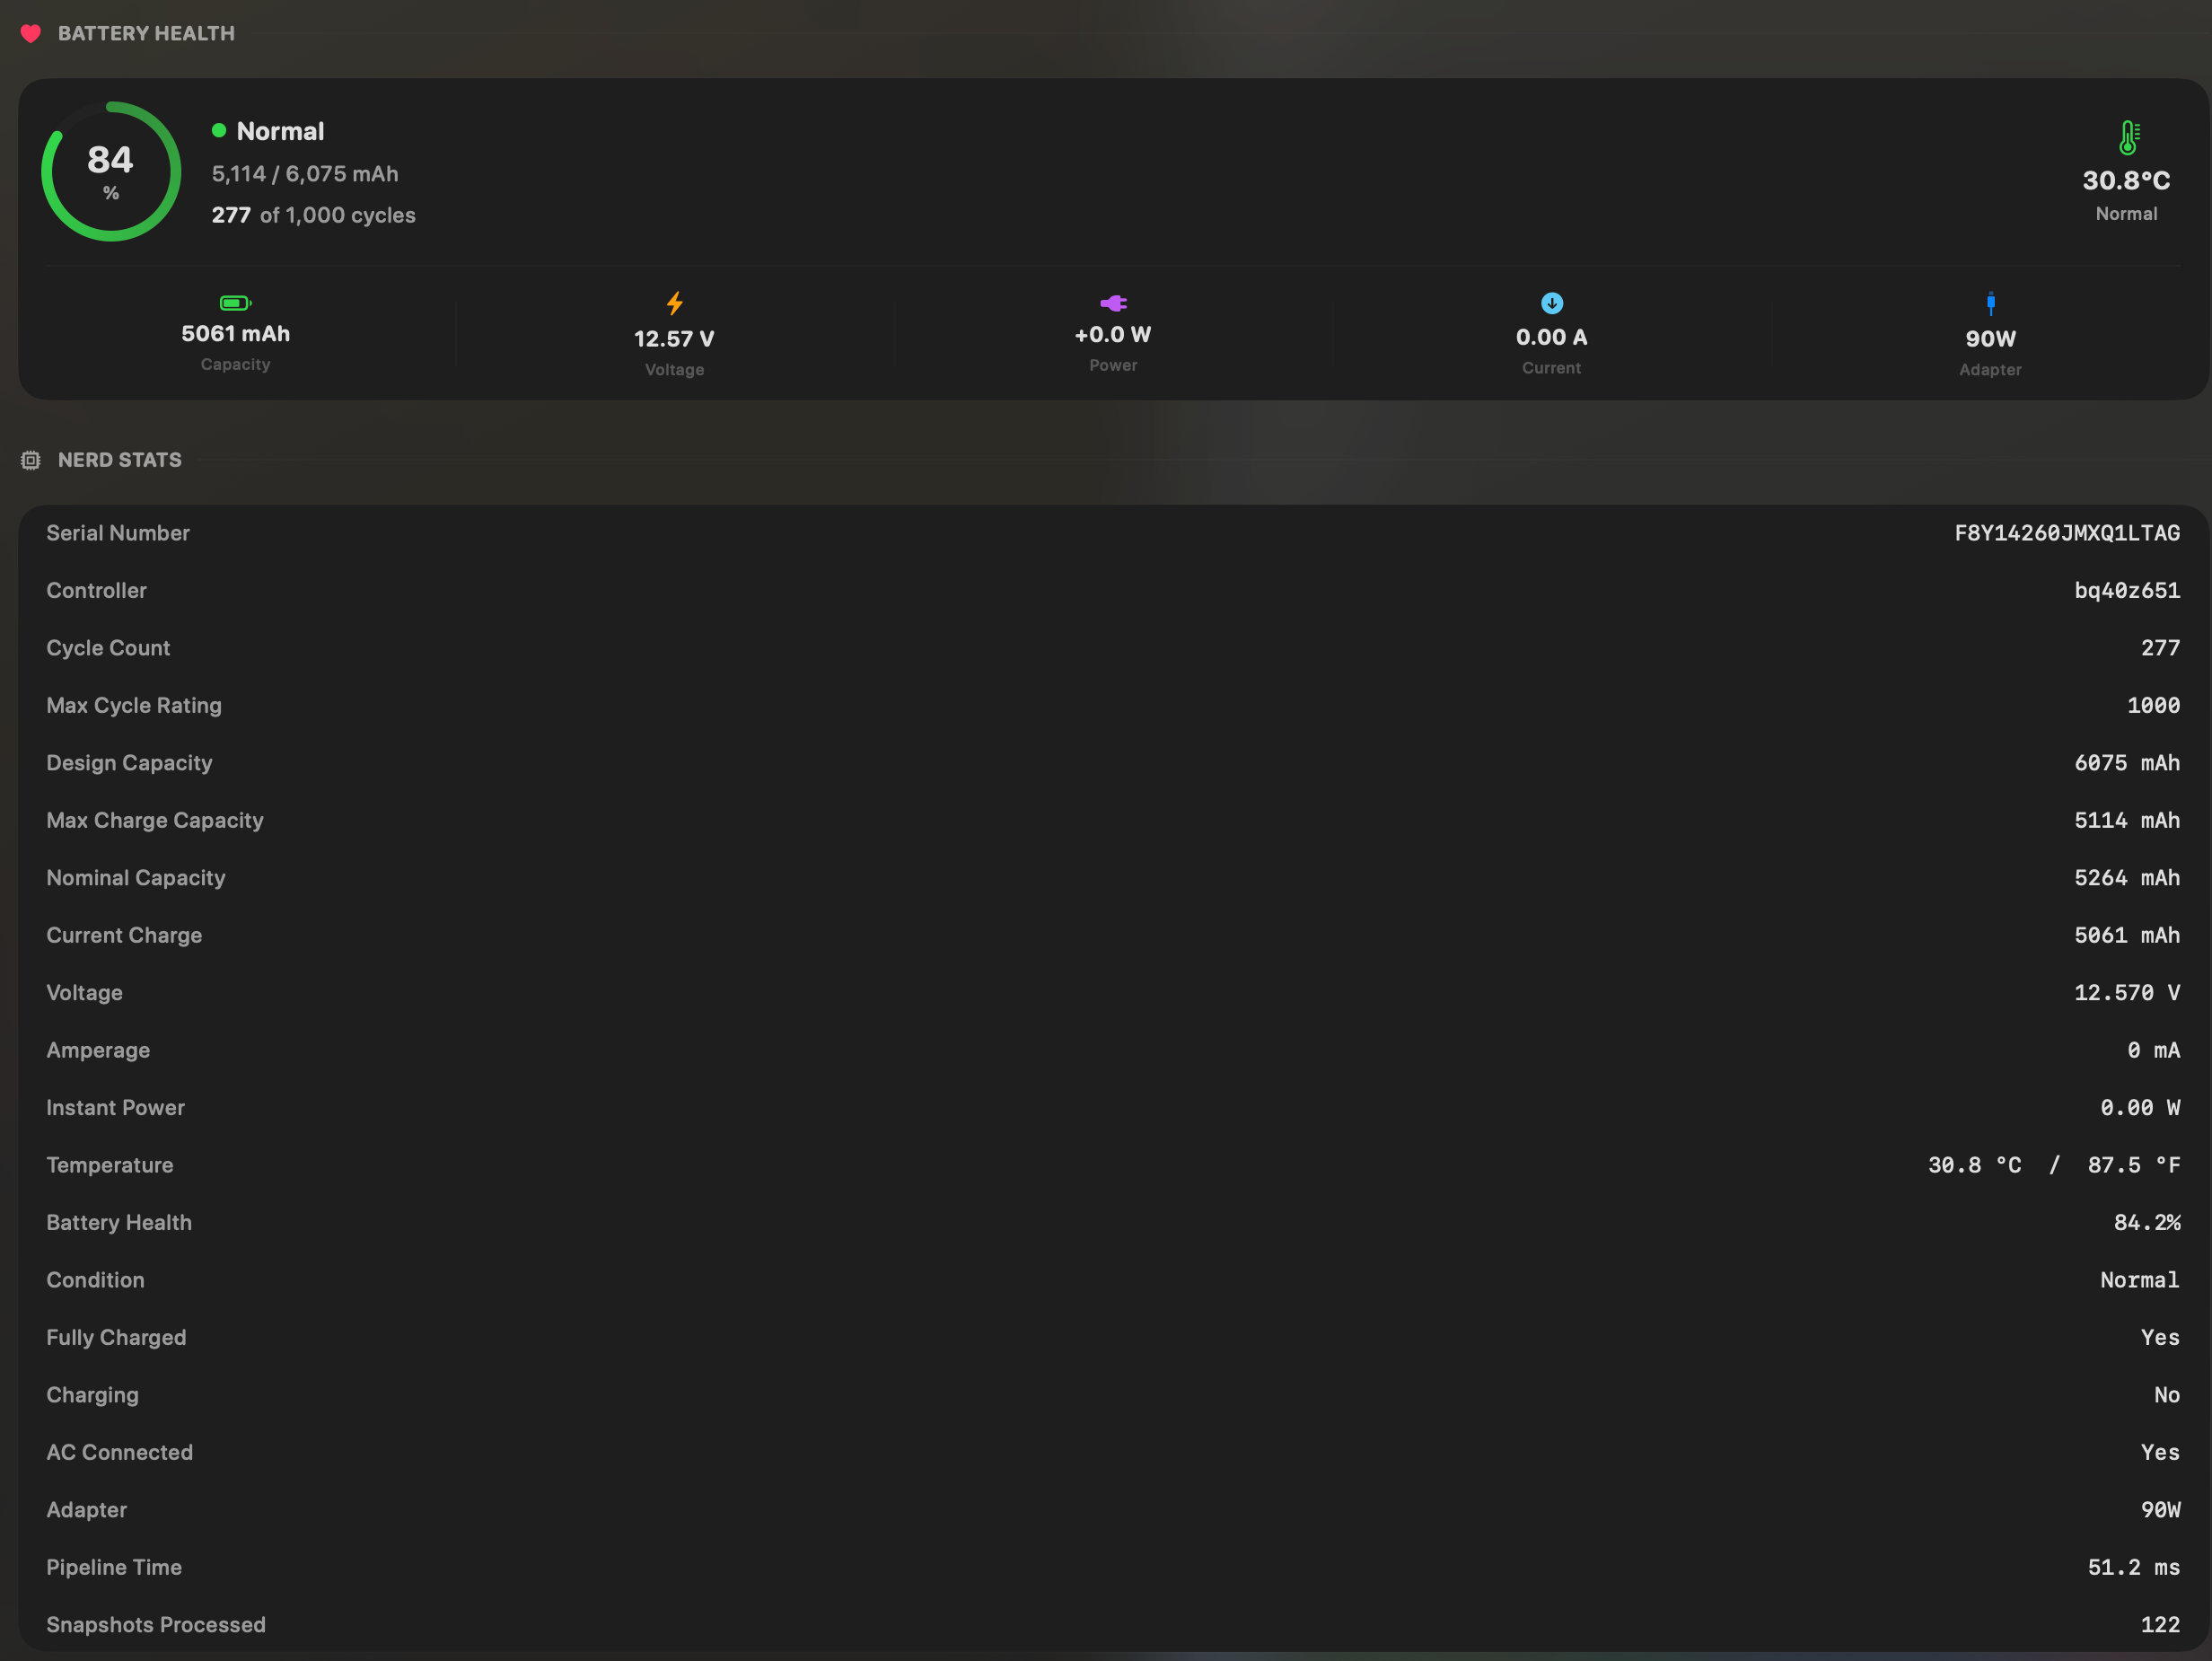
- Yes:Battery health % · Health % + condition label
- Yes:Cycle count · Cycles + design cycle count
- Yes:Battery temperature · °C / °F with status label
statsDraw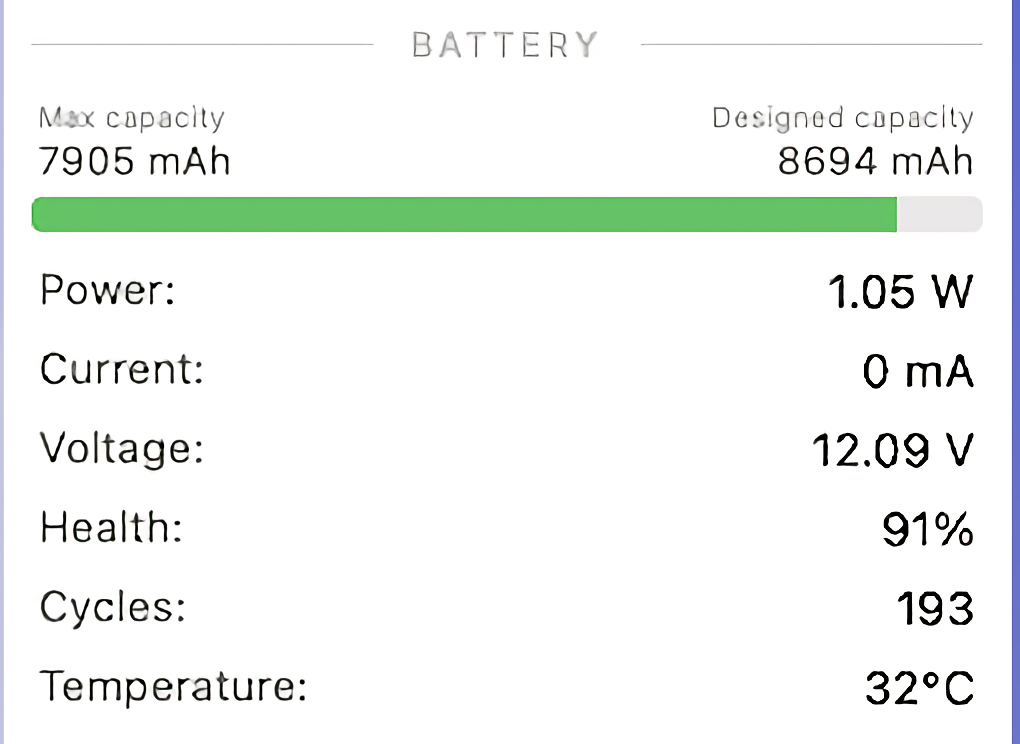
- Yes:Battery health %
- Yes:Cycle count
- Yes:Battery temperature
Menu bar and history
Both live in the menu bar. stats keeps a mini graph per metric. MacBookBatteryMonitor keeps battery level and per-app energy history from 1 hour to 7 days.
MacBookBatteryMonitorWinner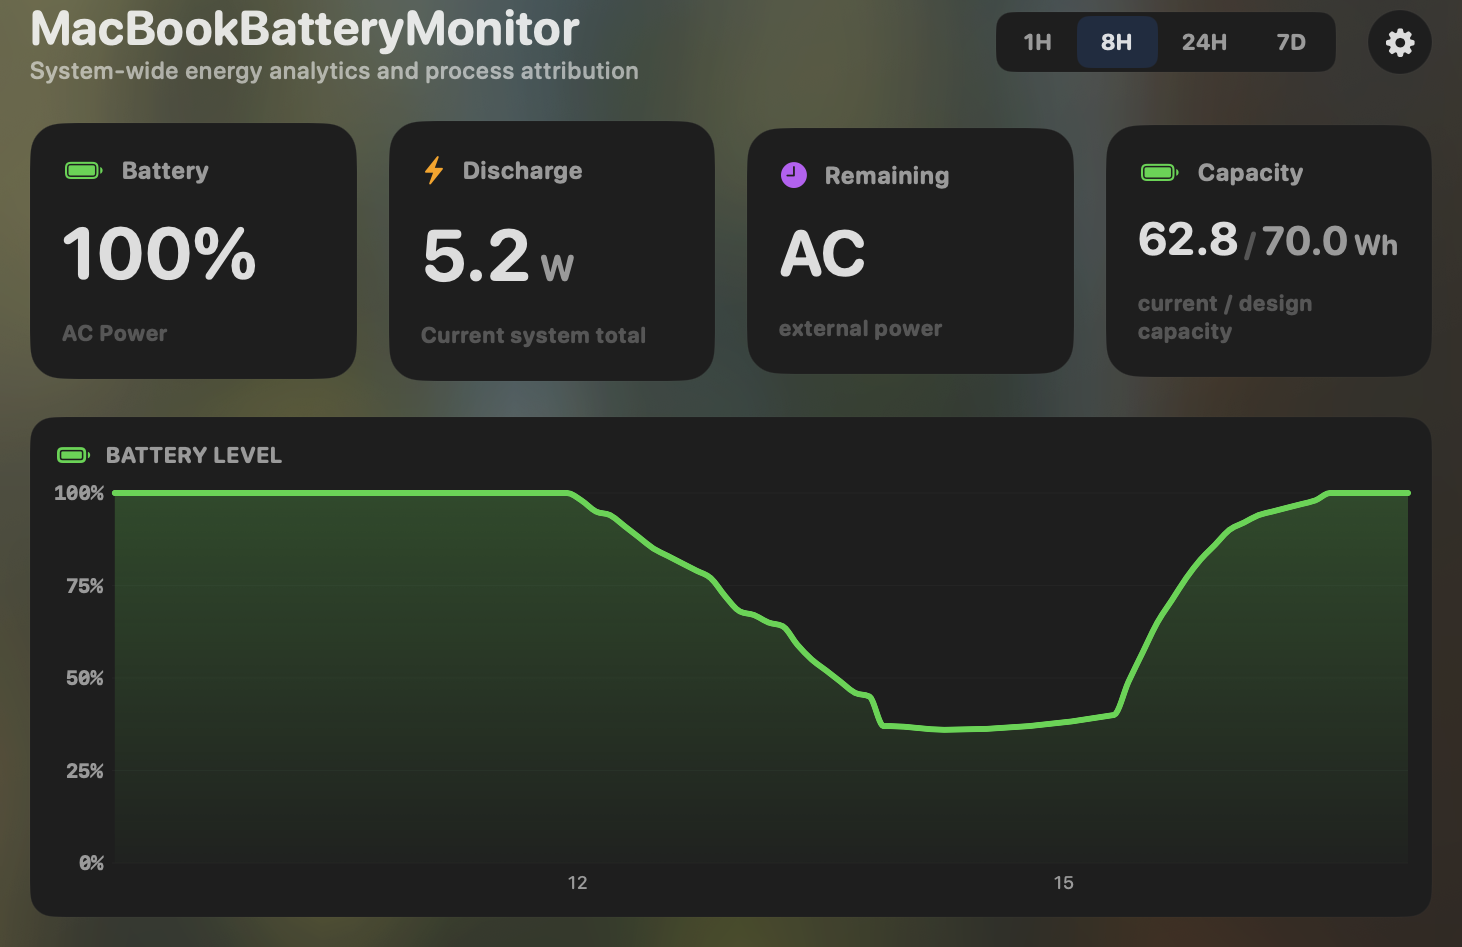
- Yes:Menu-bar first · Native, configurable icon
- Yes:History charts · 6h / 24h / 7d + per-app
stats
- Yes:Menu-bar first
- Partial:History charts · Per-metric mini graphs
Feature comparison
 MacBookBatteryMonitor
Why consider MacBookBatteryMonitor
See the drain, then do something about it
stats is a free system monitor. MacBookBatteryMonitor adds per-app watts, charge control, Sailing Mode, and per-app controls stats does not have.
What stats does
stats, by Serhiy Mytrovtsiy, is a free, MIT-licensed menu-bar system monitor with over 41,000 stars on GitHub. It is the most popular open-source app in this category. Its battery module reads health percentage (computed from max and design capacity), cycle count, capacity in milliamp-hours, voltage, amperage, temperature, time remaining, and adapter info. It shows total system power in watts via an SMC key, and it surfaces Apple’s Optimized Charging and "on hold" status. Its "Top Processes" list comes from shelling out to macOS’s top command with the power column, which is the same unitless energy-impact score Activity Monitor uses, not real watts. The wider app covers CPU, GPU, memory, disk, network, sensors, and fans, with deep customisation and 30-plus community translations. What it does not have is any battery control. Charge limiting has been requested and closed as not implemented, because macOS exposes no public charging-control API. There is no Sailing Mode, no Low Power Mode automation, and no per-app throttle, offload, or kill. It is a monitor. It does not act.
What MacBookBatteryMonitor does
MacBookBatteryMonitor is narrower and paid, but it covers the half of the battery problem stats does not touch. It shows real per-app wattage rather than a unitless score, plus a component breakdown (CPU, GPU, RAM, display, USB) and hidden drain from Docker, cloudflared, and launchd. It has the controls stats lacks: a 50% to 100% charge limit over SMC, Sailing Mode, automated Low Power Mode, and per-app actions including a CPU throttle, an E-core offload toggle, and a one-click kill. It does not monitor CPU, GPU, memory, disk, network, sensors, or fans, and it is not free. It is Apple-Silicon-only on macOS 14.6 and up.
Which one should you pick?
If you want a free, open-source, whole-system monitor, stats is the right choice and you should use it. It is excellent. For battery specifically, it reads vitals and stops. MacBookBatteryMonitor is for when you want real per-app watts, charge control, and the ability to throttle or kill what is draining you, and you are willing to pay for it. These are not really competitors. Many people will reasonably run stats for the system and MacBookBatteryMonitor for the battery.
Related guides
Frequently asked questions
Does stats show per-app power draw in watts?
No. It shows a "Top Processes" list using macOS’s top power column, which is the same unitless energy-impact score as Activity Monitor. It shows the system total in real watts via SMC, but per-app it only has the relative score.
Can stats limit charging?
No. Charge limiting has been requested on GitHub and closed as not implemented, because macOS exposes no public charging-control API. stats is read-only on battery.
Is stats really free?
Yes. It is MIT-licensed open-source software with no paid tier and no ads. If it does what you need, there is no reason not to use it.
Sources
Feature and pricing claims on this page come from stats’s own documentation and Apple’s published guidance.